

Improving Your Financial And Management Reports
Is it possible to improve your financial and management reports with your current accounting software? Do you spend hours building the reports in Excel, or do you find you are not even able to build the desired reports? Perhaps the issue is your current accounting software’s architectural design.
Great financial and management reports and graphs begin with the accounting software architectural design and a properly designed chart of accounts (COA). Unless the data entry process enables the user to include the information that will later be used to create the reports, it will be very difficult or impossible to build the needed reports. With the improvements in technology, there is an accounting software that is architecturally designed to enable the users to create meaningful and applicable reports and visually stunning graphics that are informative and provide decision making information in a timely manner without the need for a programmer, and they are mobile-device accessible.
INTACCT: Intacct has the accounting software architecture that enables the reportable information to be assigned to accounting transactions that occur in both the General Ledger (GL) and the sub-ledgers. The sub-ledgers update the GL, thereby making the information available for financial and management reports and graphics. Intacct uses up to 11 dimension fields and one COA field to capture the information within the sub-ledgers and the GL.
COA: The COA field captures the debit and credit amounts for the assets, liabilities, equity (net assets), revenues, and expenses. Organizing them into group associations will not only decrease the reporting and graphic build times, but will also reduce reporting and graphic maintenance. For example: order your COA numbers so that all the payroll expenses, the utilities, the general administrative, etc. group together.
DIMENSIONS: The dimension fields capture the information for locations, departments, classes, vendors, customers, employees, projects, and items. There are an additional 3 dimension fields that are user defined. The dimensions can be repurposed based on the overall reporting and graphic needs. For example: you may not have anything that relates to classes, but you have products. You can rename “Classes” to “Products” and create reports and graphics based on the Product dimension. Learn more…
REPORTS & GRAPHS: Once the accounting transactions have been entered into Intacct with their respective COA and dimensions, you are ready to start building your own financial reports and graphs without having to wait for either a programmer or IT support. Intacct has developed the matrix reporting functionality that allows the users to create many different views of their data. Since Intacct upgrades on a quarterly basis, you will not have to wait years to have new reporting and graphic functionality.
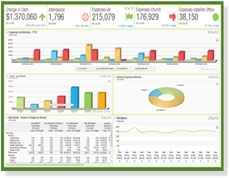
DASHBOARDS: Intacct dashboards enable you to present the reports and graphics in a stunning and organized manner that is designed to meet the needs of a specific individual(s). You will have the ability to create multiple dashboards for the same person. The CFO may have several dashboards: one for the company overview, another to show how each division or department is doing, one to show who the top customers are, another to show which vendors the company uses the most, and another to show which locations are most productive, etc. Furthermore, the CFO, or anyone else with dashboards, can access the dashboards using their mobile devices.
By using Intacct, with its GL account number architecture and its ability to tag every business transaction with a COA and dimension(s), you will have more reporting and graphics functionalities that are mobile device accessible.
Contact us to learn more about obtaining the reports and graphs you have been wanting.